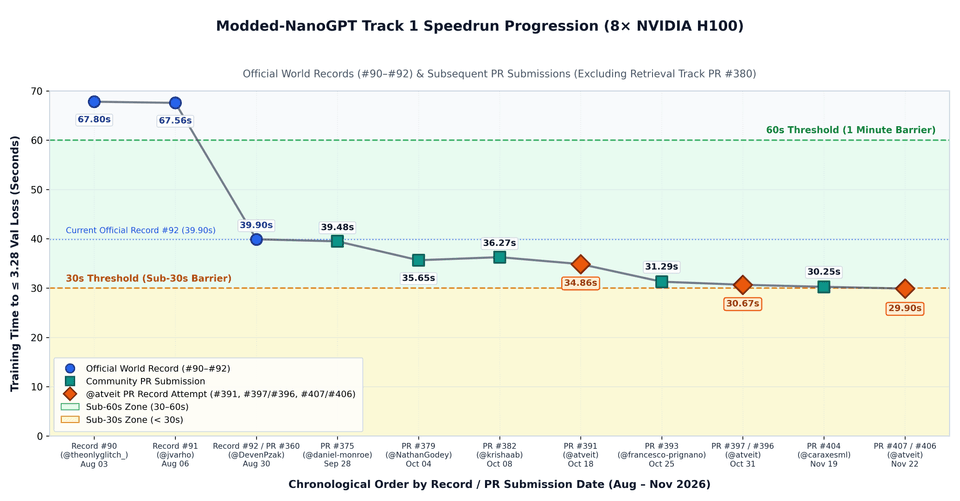
⚠️ This is a record attempt, built on other people's work. It is submitted as PR #406 (code) and PR #407 (runs and logs), and both are in review. It only becomes an official record if the maintainers verify it on their own hardware. All numbers below are from one rented 8×H100 node on runpod.io.
Modded-nanogpt is a community speedrun: train a GPT-2-scale language model from scratch on 8 NVIDIA H100 GPUs until it reaches a validation loss of 3.28 or lower, as fast as possible. Since 2024, dozens of contributors have taken that run from 45 minutes all the way down to around 30 seconds.
Three weeks ago, my second attempt hit 30.67 seconds (#396/#397). Since then, @caraxesml made another big jump with PR #404 — 30.25 seconds on GKE (and 30.05 seconds on our RunPod node).
That left the 30-second barrier just 50 milliseconds away.
This third attempt stacks cleanly on #404 with +175 net lines across 8 files. Same model, same data, same 1,053 training steps, and the exact same math — just less wasted GPU work. On the same 8×H100 node, it shaves off 145 milliseconds and crosses cleanly under 30 seconds at 29.90 seconds.
(Quick note on rules: this is Track 1, the standard from-scratch pretraining ruleset. Separate retrieval-hybrid tracks like #380 reach 5–10 seconds under different rules that allow exact lookups from training data.)
Standing on other people's work
Almost everything that makes this model fast comes from Keller Jordan (who started the speedrun), @francesco-prignano (PR #393), and @caraxesml (PR #404).
Because different cloud clusters run at slightly different speeds (#404 ran 30.25 s on GKE vs 30.05 s on our RunPod node), we timed #404 and our code back-to-back on the exact same machine.
Why "same math" can still run faster
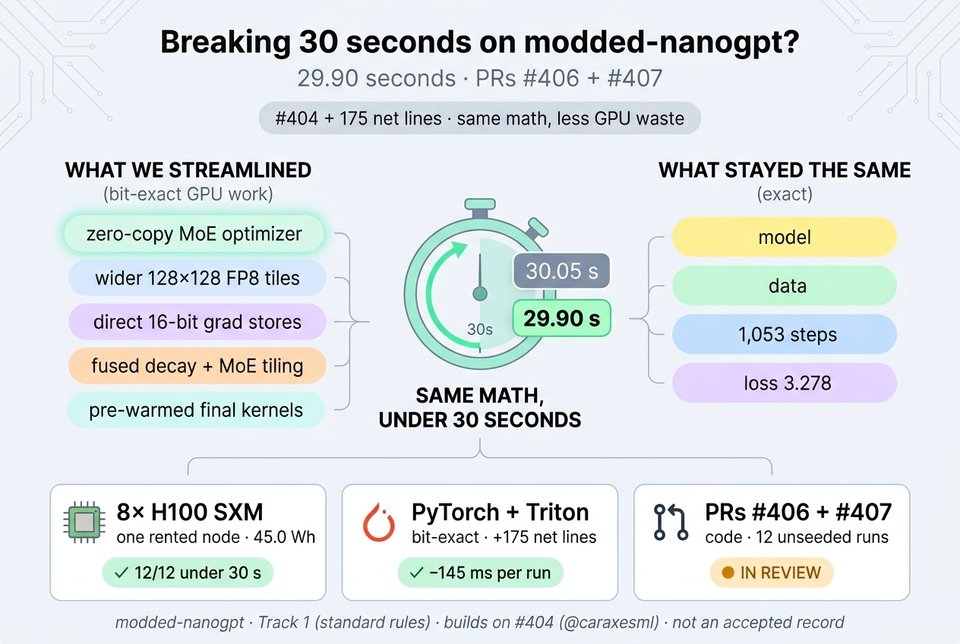
Modern GPUs are extraordinarily fast at arithmetic, so they often spend their time waiting on memory traffic or tiny setup overheads rather than math. Two simple ideas account for most of our 145 ms gain:
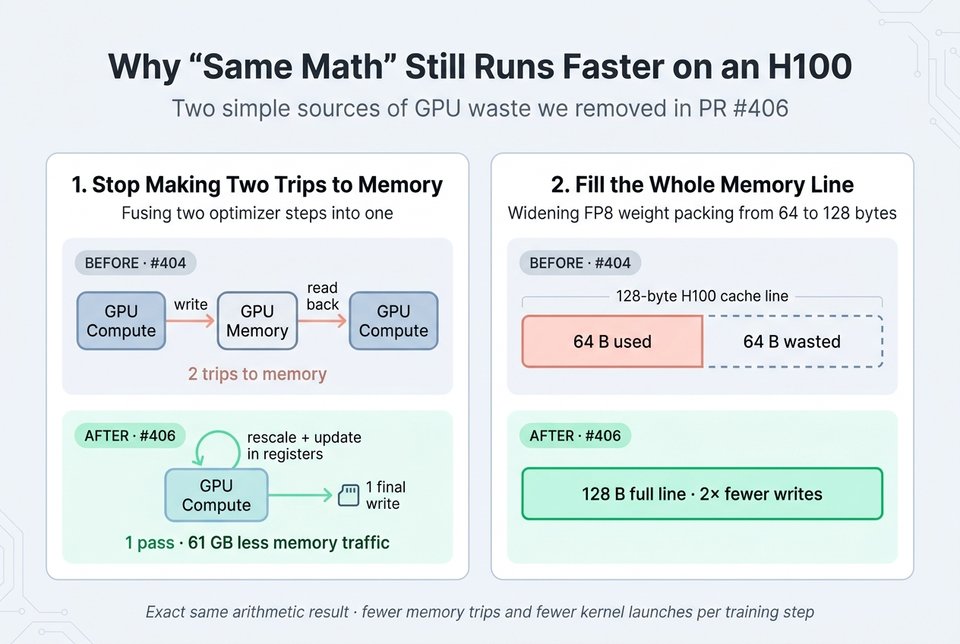
Here are the six small fixes in PR #406 in plain English:
- One optimizer pass instead of two. The optimizer rescaled each weight row, wrote the result out to GPU memory, and immediately read it back to apply weight decay. Combining both into one compiled pass keeps the intermediate value in fast on-chip registers and cuts 61 GB of memory traffic:
# before (#404): write v_chunk out to GPU memory, then immediately read it back
v_chunk.mul_(eq_scale.type_as(v_chunk))
_sign_aligned_decay_update(p, mantissa, v_chunk, ...)

# after (#406): fuse both into one compiled pass (same bf16 rounding, zero round-trip)
update = (v_chunk * eq_scale.type_as(v_chunk)).float()- Fill the full 128-byte memory line. When packing model weights down to 8-bit (
FP8), the GPU was writing 64 bytes at a time — half of an H100's native 128-byte memory line. Widening the tiles to128×128fills the whole line in one write, and folding the scale calculation into the same kernel cuts extra launches. - Skip an extra copy in the MoE optimizer. The model's specialist sub-networks (Mixture-of-Experts) were taking a slower optimizer path that made a separate copy of the weights. Moving them to the fast custom path and hiding that copy on idle GPU cores removes the extra step completely.
- Write 16-bit gradients directly. Gradients for the token-copying layer were written out as 32-bit floats and converted to 16-bit (
bfloat16) in a second step. Casting them on the way out cuts memory traffic in half with identical bits:
# before (#404): store float32 temporaries, then cast to bf16 in a second pass
tl.store(DQ + offs, dq * scale)
return dq.to(q.dtype), dk.to(k.dtype)

# after (#406): cast on the way out — half the memory traffic, identical bits
tl.store(DQ + offs, (dq * scale).to(DQ.dtype.element_ty))- Spread work evenly across all 132 GPU cores. A 4-line tile tweak (
128×256→128×128) in the MoE backward pass creates twice as many independent work blocks, keeping all 132 compute units on each H100 busy instead of leaving some waiting. - Warm up final-step kernels before the clock starts. PyTorch loads some GPU kernels lazily the first time a code path runs. Triggering the end-of-run weight-averaging path once during untimed setup keeps that one-time loading cost off the stopwatch.
The numbers
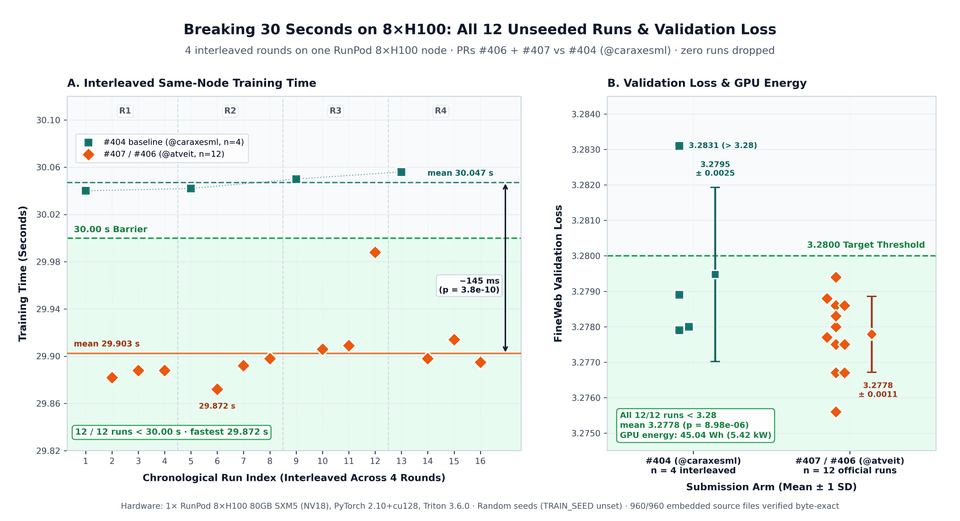
To rule out hardware drift, we ran 4 interleaved rounds on one RunPod 8×H100 node (1 × #404, then 3 × this PR), with random seeds and zero runs dropped:
| runs | mean time | range | validation loss | |
|---|---|---|---|---|
this attempt (#404 + #406) |
12 | 29.90 s | 29.87–29.99 s | 3.2778 |
#404 interleaved (same node) |
4 | 30.05 s | 30.04–30.06 s | 3.2795 |
#396 (my 2nd attempt, same node) |
2 | 30.58 s | 30.57–30.59 s | 3.2786 |
- 145 ms faster than
#404on the exact same machine (p < 10⁻⁹), and 0.68 s faster than my previous#396attempt. - 12 out of 12 runs finished under 30.00 seconds and below the 3.28 loss target (
p = 8.98 × 10⁻⁶). - 45.0 Wh of GPU energy per run (5.42 kW across 8 GPUs at 72 °C max, zero throttling) — roughly the electricity needed to boil 400 ml of water in a kettle, down from 45.2 Wh on
#404and 45.6 Wh on#396.
What didn't work (and one win we threw away)
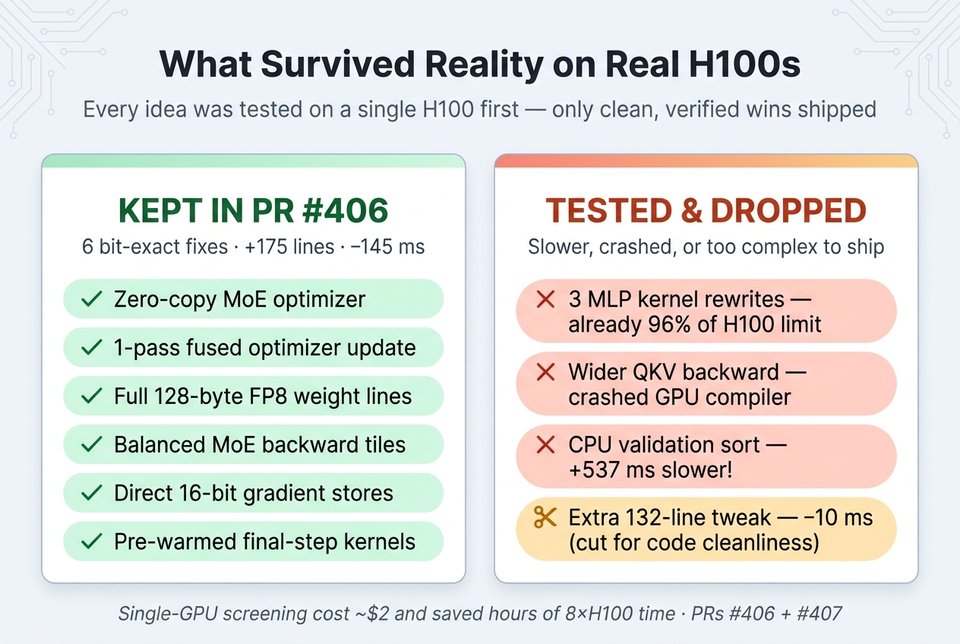
Half of our "clever" ideas failed once we measured them on real hardware. Testing every idea on a cheap single H100 pod first (about $2 total) saved hours of 8×H100 time:
- Three dense-MLP rewrites all ran slower —
#393's kernel was already sitting at ~96% of the H100's hardware limit. - Widening the attention-prep backward kernel crashed NVIDIA's GPU compiler (
ptxasSIGSEGV). - Sorting validation IDs on CPU looked tidy on paper, and accidentally added +537 ms before we caught and reverted it.
- We also threw away a working 10 ms win. An extra 132-line optimization pushed the run to 29.88 s (also passing
n = 12, p = 0.0058), but we cut it from the PR to respect the repo's cleanliness rule: 132 lines for 10 ms isn't worth the complexity.
What's next
A final GPU profile of our winning run shows roughly 10% of GPU time still goes to multi-GPU communication (gradient exchanges and n-gram lookups). Trimming or overlapping more of that looks like the cleanest path toward 29 seconds flat.
Thanks to Keller Jordan for the speedrun, @francesco-prignano for #393, and especially @caraxesml for #404. Even if #406/#407 doesn't hold up on maintainer hardware, breaking 30 seconds on a rented node — and seeing which ideas survived reality — was a lot of fun.
ℹ️ How this attempt was made
I used Google Antigravity with Gemini agents running in parallel for GPU profiling, Triton/PyTorch kernel work, single-GPU parity checks, RunPod provisioning, and clean zero-interference 8×H100 runs.
Development and dead-end screening ran on single H100 pods (about $2), followed by 2 hours 48 minutes on one 8×H100 SXM node on RunPod for the interleaved certification runs and final profile. Every run is counted, and every log embeds the exact source code that produced it.
The submission, its claims and any mistakes are mine.
Best Regard,
Amund